
A=d²

figure 1
Discovery
One circle in four circles, in a square grid (2x2) combined with the negative space between the four circles.
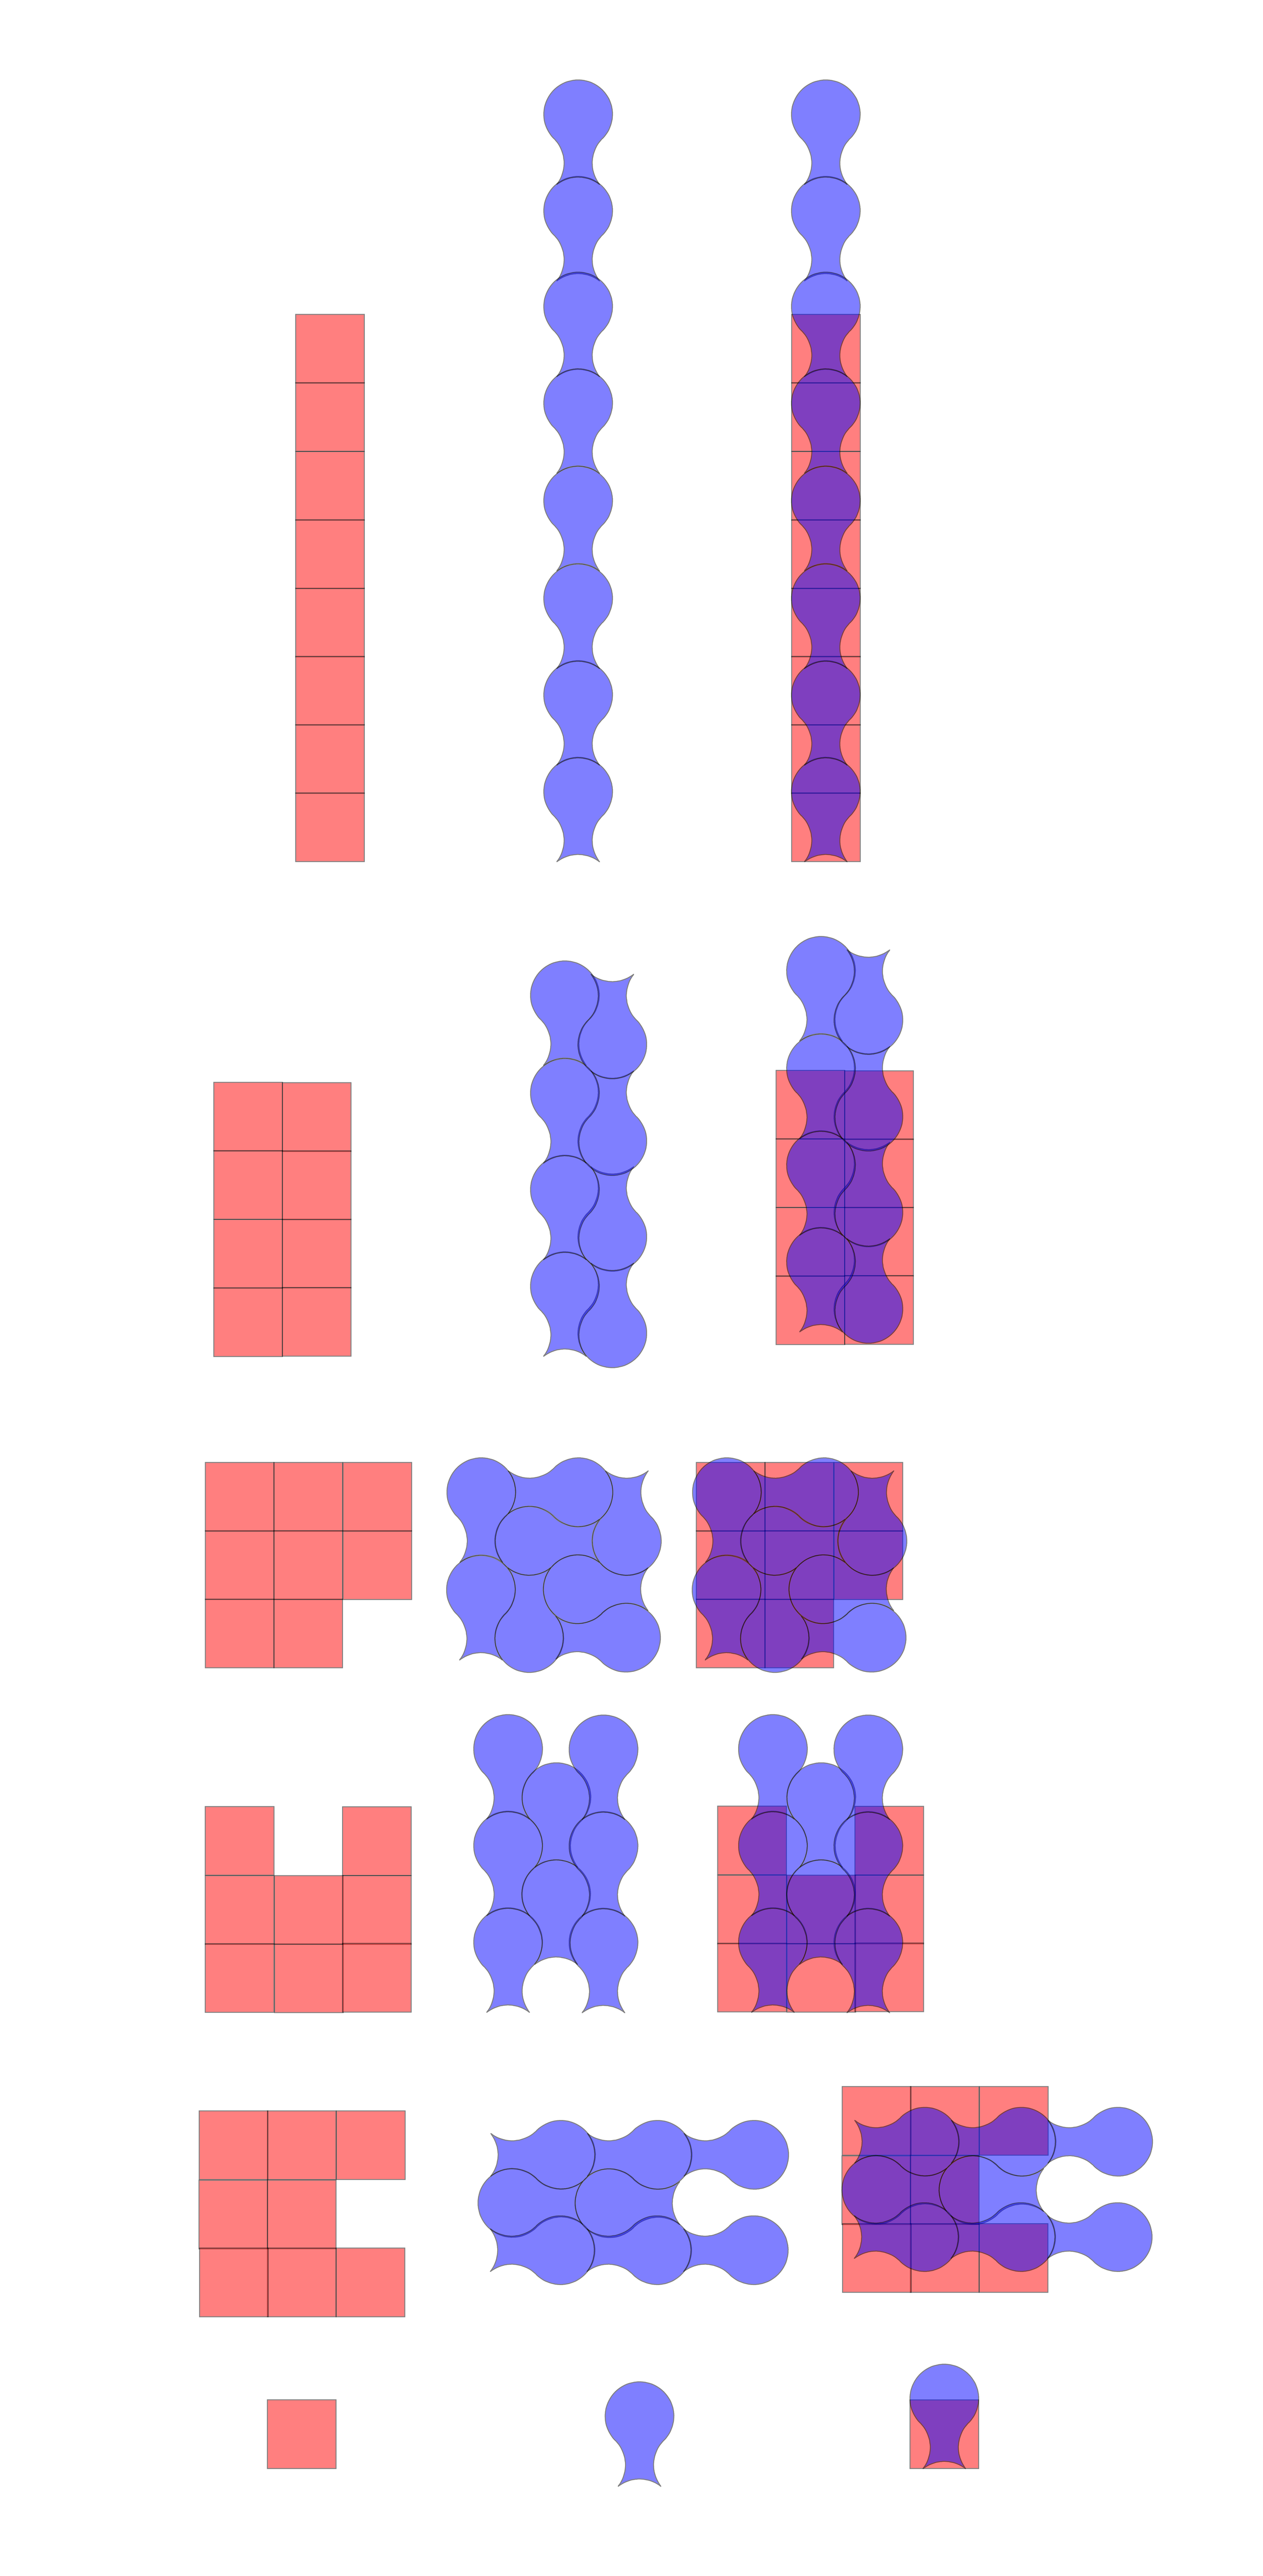
Area
This is a proof for determing the area as culculated by A=d².
The first row of shapes measures each shape with the same line segment.
The second row of shapes shows how to rearrange a square to assemble the shape, using the previous row of shapes.

figure 2

figure 4

figure 3
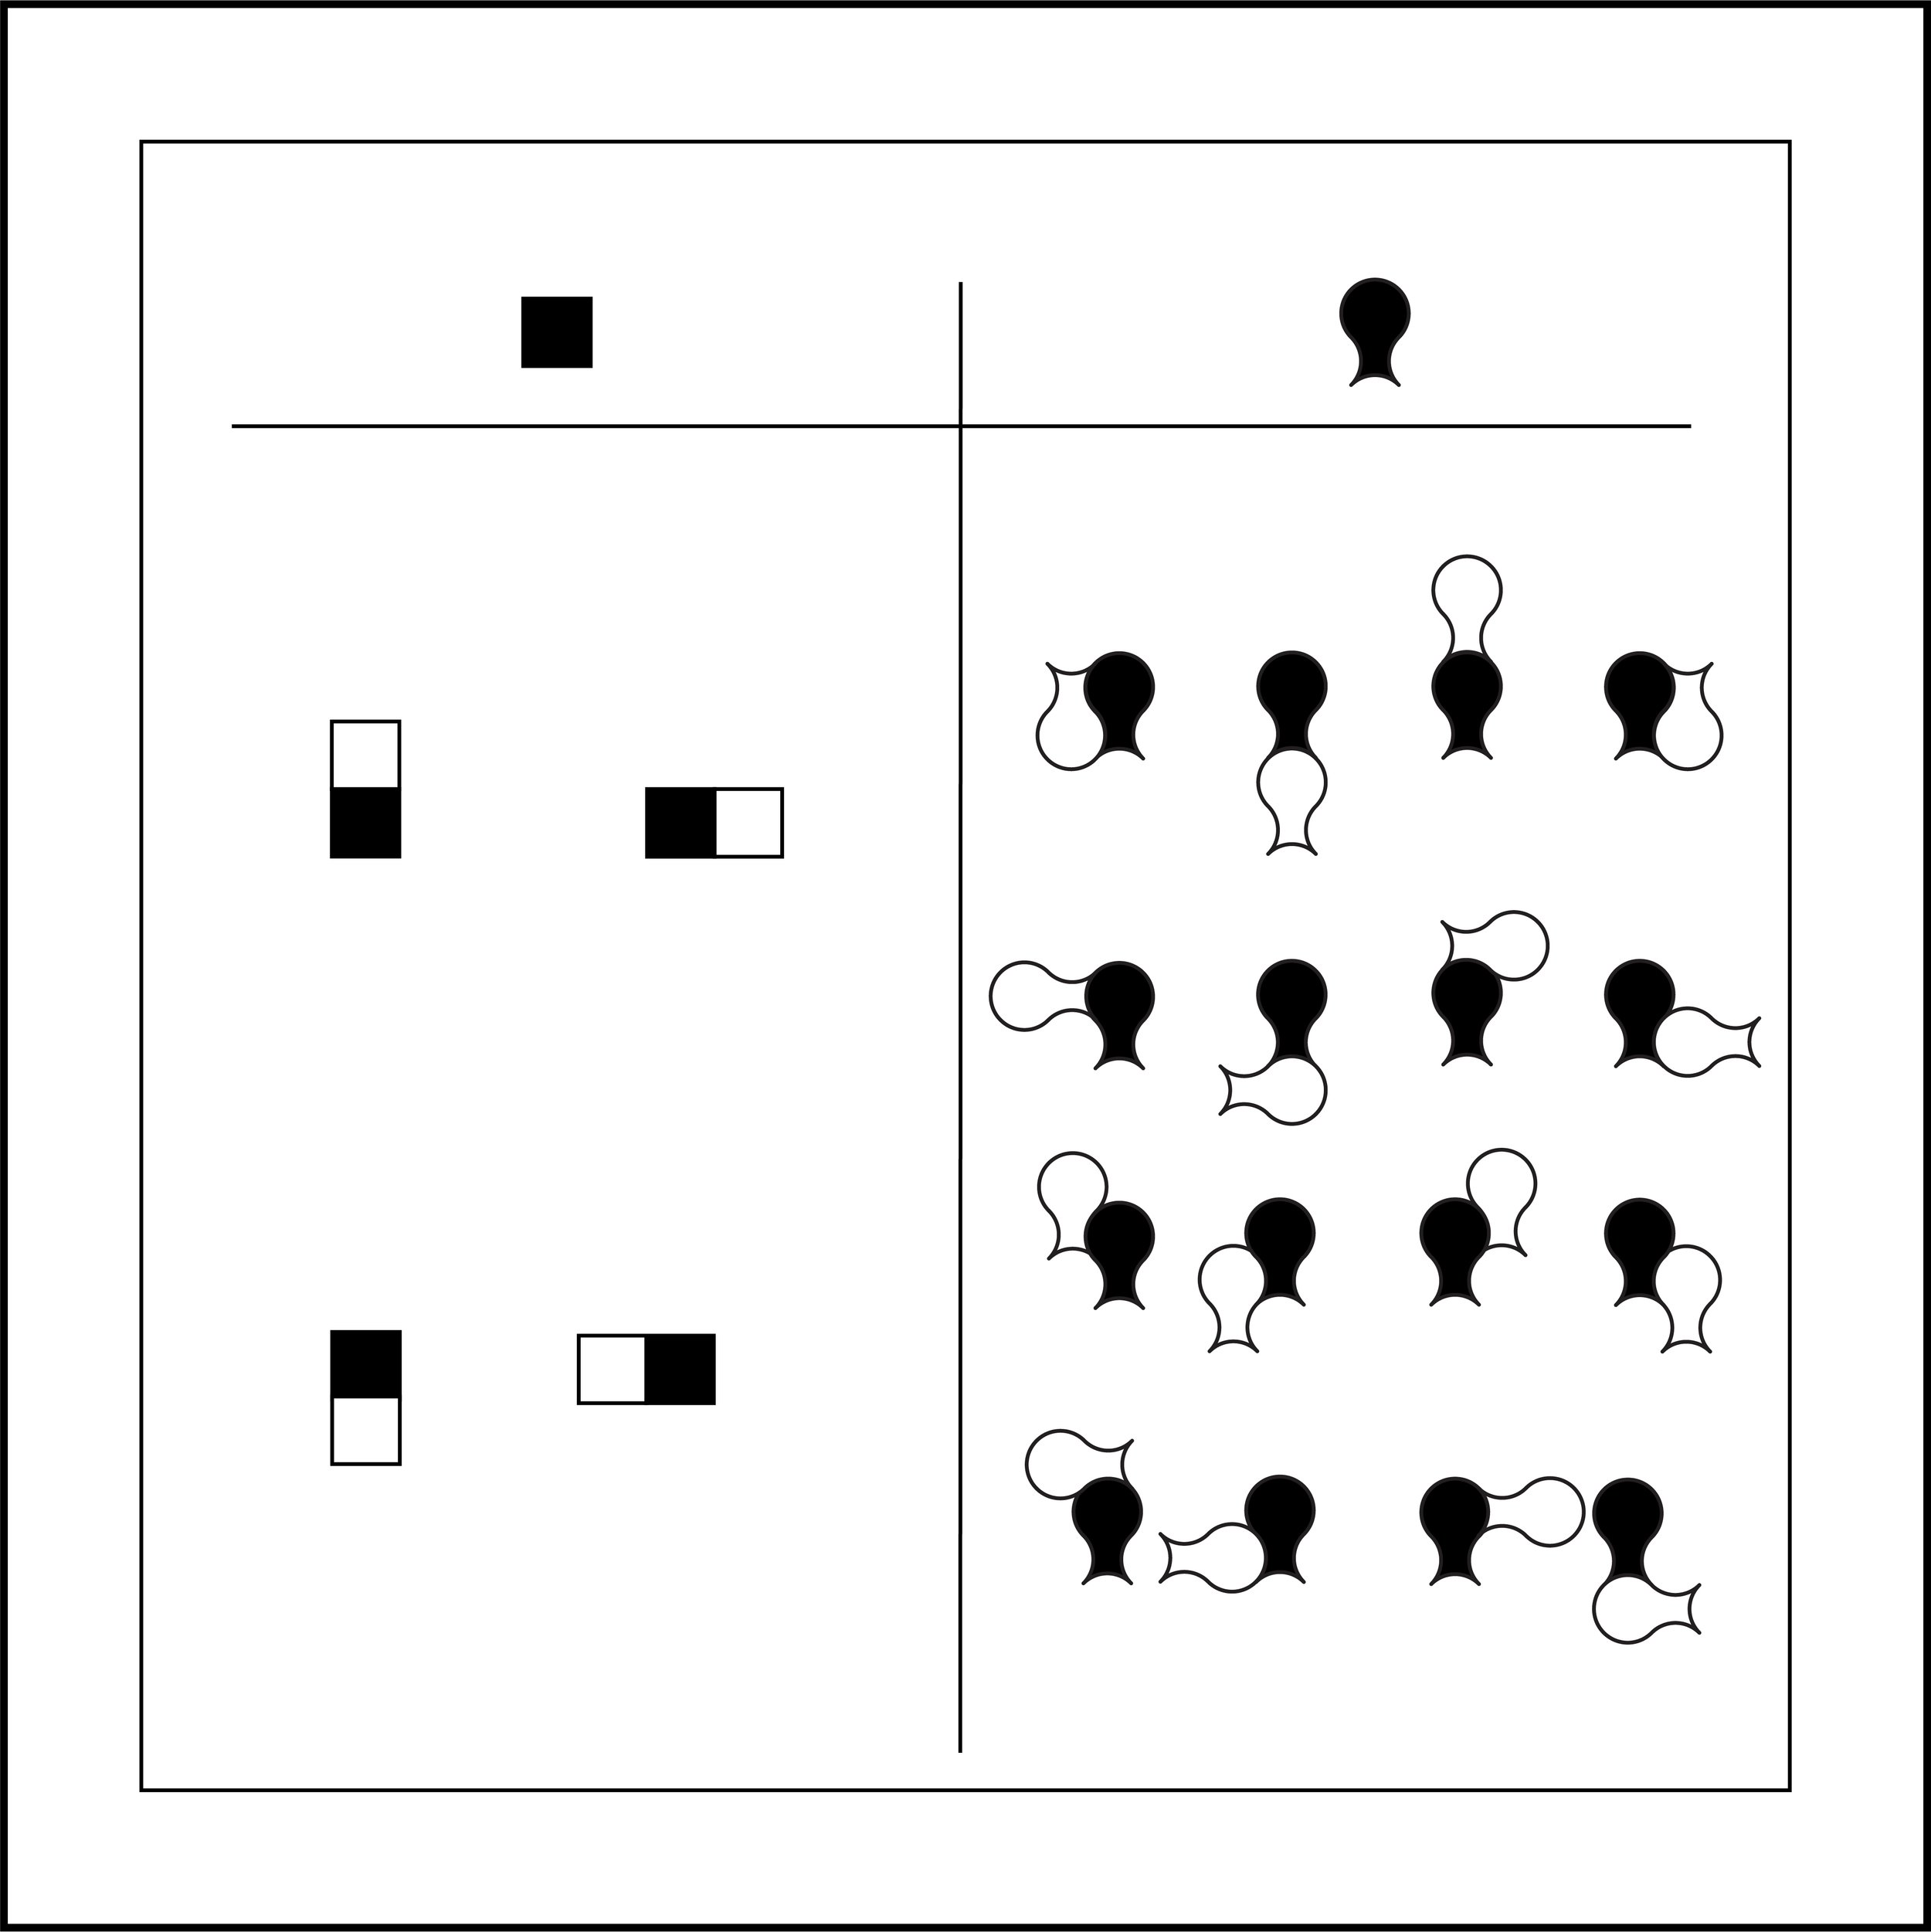
figure 5
16 points of connectivity
If a square can connect to itself 4 times, figure 3, than this shape can connect to itself 16. This makes for more possible outcomes per entry.
This is the version I am in the process of naming and numbering.
24 Points of Connectivity
If a square can connect to itself 8 times, figure 6, than this shape can connect to itself 24. This makes for a greater possible outcomes per entry.
I’m hoping to uncover some information from writing the 16 point variation combination list out long form, enough to simplify the process of counting the 24 point variation.
One thing to briefly note here, think the literal degrees involved with each placement. A square has 90 and 45, from center to center. This shape has several options. This, on a single additional layer of tile.

figure 7

figure 6

figure 8

figure 9
Symbols Which Share Similar Properties
Each of these symbols can connect to themselves in the same way the shape that I am introducing can.
The dot and line variation on the right side is the version I use for shorthand.


HOW MANY TIMES CAN THE SHAPE CONNECT TO ITSELF?
Counting the 16 points of connectivity.
How To Count
Key


When two or more tiles are placed around the center tile, there is a chance that they will stack on top of one another. This key shows which arrangement overlaps each specific placement. Imagine they were physical tiles, without cutting them, they would not lay flat.
For example,
if Tile ‘A’ is placed, it can not also be placed with tile ‘B’ or ‘P’ as they share the space directly above the center tile on tile ‘A’.
or if tile ‘E’ is placed, it can not also be placed with tile ‘C’, ‘D’, ‘F’ or ‘G’ as they share the same space on the right of the center tile on tile ‘E’
Counting
The goal is to count the possible combinations of tiles around a center tile.
Figure 1
Each tile, not including the center tile, is marked with x. Each new arrangement is marked by 1 . Each impossible combination is marked by 0.
Both the left and the right column will count each possible arrangement on both their x and y axis. The left column will number them, the right column will name them. Each column checks and labels eachother’s tables.
Image 2, 3
By using the data from the first segment in Image 1, we are able to both make a unique line for ‘AC’ and the possible combinations with ‘AC’ beginning with ‘ACF’.
This process is repeated until ‘DGJLNP’
Image 1

image 2

image 3


Distribution of Space
Each individual shape shares the same area. See the shape handle space differently.


Overview


